Introduction
Imagine you're a chef who wants to create a beautiful recipe book. Instead of writing the recipe in a plain text file, you want to include interactive elements like clickable ingredients, step-by-step videos, and even a live cooking timer. In the world of data and technology, this is exactly what interactive dashboards do – they take raw data and turn it into engaging, interactive visual stories.
This article will explain how to build these interactive dashboards using a Python-based tool called Prefab, which allows developers to create dashboards entirely in Python. We'll also learn how to export these dashboards as static HTML files so they can be shared and viewed anywhere.
What is a Dashboard?
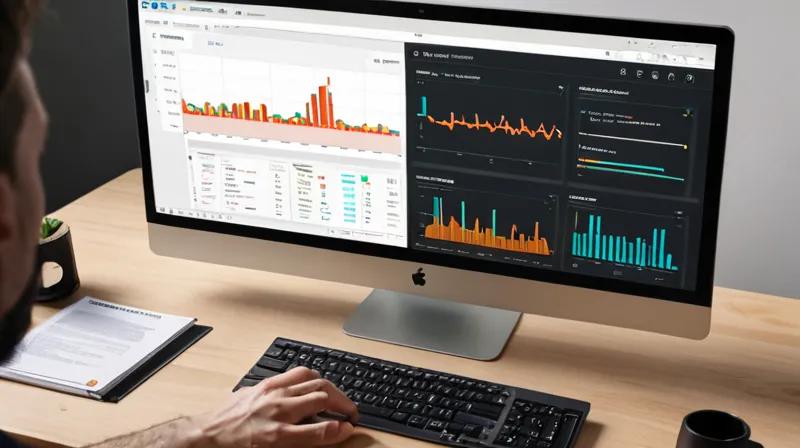
A dashboard is like a control panel for your data. It's a visual display that shows important information at a glance. Think of it as a window into your data, where you can see trends, statistics, and key metrics in an easy-to-understand format.
For example, a store manager might use a dashboard to see daily sales, inventory levels, and employee performance. A scientist might use one to monitor real-time data from experiments. Dashboards are powerful because they make complex data understandable and actionable.
How Does Prefab Work?
Prefab is a Python library that helps developers create interactive dashboards using only Python code. It's like having a set of LEGO blocks – you can build complex dashboards by combining simple, pre-made components.
Here's how it works:
- Reactive UI Components: These are interactive parts of the dashboard that automatically update when data changes. For example, if you filter data by date, the charts and tables will automatically refresh to show only that date range.
- Python-First Approach: Unlike some dashboard tools that require mixing Python with other languages, Prefab lets you build everything in Python. This is easier for Python developers who don't want to learn new languages.
- Static HTML Export: Once you build your dashboard, you can export it as a regular HTML file. This means you can share it with anyone, even if they don't have Python installed.
Think of Prefab like a magic wand that turns your Python code into a beautiful, interactive dashboard. You simply write Python code, and it creates the visual elements for you.
Why Does This Matter?
This approach matters because it makes dashboard creation more accessible and efficient. Here's why:
- Speed: Developers can build interactive dashboards quickly without switching between multiple tools or languages.
- Accessibility: Since everything is in Python, data scientists and analysts who are already familiar with Python can create interactive dashboards without learning new tools.
- Sharing: The ability to export as HTML means dashboards can be shared easily, even with people who don't have Python installed.
- Real-time Updates: Dashboards can update automatically when data changes, making them perfect for monitoring systems.
For example, a marketing team could create a dashboard that shows real-time social media engagement. When new data comes in, the dashboard automatically updates to show the latest numbers, helping the team make quick decisions.
Key Takeaways
Here are the main points to remember:
- Interactive dashboards are visual tools that display data in an easy-to-understand format
- Prefab is a Python library that lets you build dashboards using only Python code
- Reactive components automatically update when data changes
- You can export dashboards as static HTML files for easy sharing
- This approach is faster and more accessible for Python developers
Whether you're a data scientist, analyst, or just someone who wants to visualize data, understanding how to create interactive dashboards with tools like Prefab can help you communicate information more effectively. It's like having a powerful storytelling tool that turns numbers into compelling visual narratives.